Thursday 21 June 2012

Candlestick Patterns - Bullish / Bearish Engulfing

Finally, a post in the tutorial section. Its been ages since I wanted to do a post here and am very relieved that finally its happening. I may be little rusty here so please excuse me.

Just a little recap before we proceed. So far we have covered many candlestick patterns;

Single Candlestick Patterns


Multi-Candlestick Patterns


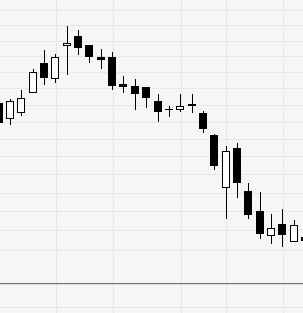
Final installment of these candlestick patterns was remaining which we will visit today. It is Bullish / Bearish Engulfing.

Bullish Engulfing

It is very simple to understand pattern which usually occurs at the end of a downtrend and indicates reversal. It is characterized by multiple Black candles followed by a big White candle which fully covers the previous black candle. Important to note here is that the opening (bottom) of white candle is below the closing (bottom) of previous day black candle. Also closing (top) of white candle is above the opening (top) of previous day black candle.

This patterns indicates the change in the market sentiment and usually generates a reliable buy signal.

Bearish Engulfing
Need I say more.

This pattern indicates end of an uptrend and reversal in market sentiment. It indicates imminent downtrend and usually a good time to go short. It is worthwhile to note that the strength of the new direction of the market depends on how big the new candle (white in bullish engulfing or black in bearish engulfing) is and how much below or above it opened and how much above to below it closed respectively with respect to previous day's candle.

One example of bearish engulfing is SBI. During mid April when SBI was at around 2300 level, bearish engulfing appeared changing the ongoing trend. In a months time SBI reached levels of 1800.


Acting only on the basis of such engulfing is usually very difficult. One needs to corroborate such signal with other indicators and at times with fundamentals and current news about the stock. More on the comprehensive trading scenario later.

This probably is the final post on this blog address. I plan to move all these posts to Options Blog or some other blog which I will decide next month. There I will consolidate tutorials, technical indicators, charts, fundamental posts and trading posts. It will be easier for me to manage that way and will help me stay consistent in writing.

As usual, will wait for your comments.

Friday 2 December 2011

Candlestick Patterns - Three White Soldiers / Three Black Crows

I am back. Been too busy exploring new city and visiting places and it is nothing short of wonder that I still find time to write. I must be addicted I guess. Will go to JM for rehab once I am back.

Coming back to the Candlestick Patterns... today it is turn of Three White Soldiers and Three Black Crows. Both these do not occur as often as the major reversal patterns and hence are called secondary patterns. Though uncommon (just like common sense) they are very strong and reliable indicators.

Three White Soldiers

Have a look at the pattern here.


This pattern is characterized by three consecutive White (Green) candles where each candle opens within the body of previous candle and closes above it. The close is usually at or near day's high. This pattern usually occurs at the end of a long down or sideways move.

First candle indicates the exhaustion of current trend by indicating a close near day's high. Second day the price opens lower indicating sellers are still present in the market but as the day progresses, buyers overwhelm them. This is repeated again on third day indicating a definitive trend reversal.

Three Black Crows

The Pattern.


In one sentence; this is Three Black Soldiers pattern.

It is named after crows probably because Japanese people think of crows as evil birds. Needless to say, this pattern appears after a long uptrend indicating the reversal. First day indicating the change in trend and second, third days indicating unsuccessful denial by buyers. This pattern is further strong if price closes at or near day's low.

I am not posting a example of these patterns here but will mention one. Around middle of March 09 when NIFTY was around 2550-2600 level after prolonged downtrend, Three White Soldiers appeared. What followed was one of the most spectacular bullish phase taking NIFTY to above 4600 by Mid Jun (over 2000 points in 3 months) and above 5000 by Nov.

Will come back soon with the final multi-candlestick pattern. Then we proceed to charts and patterns in them along with indicators and oscillators. Can't wait to get there. It will be fun for sure.

Will try to post one today at Options Blog and will try to revive Futures Blog too. Till then, enjoy rehab.

Tuesday 29 November 2011

Investing explained well...

Well, wanted to write about the next candlestick pattern but just being lazy right now. My cousin is visiting me here in Singapore and we are watching www.bcci.tv for a delayed feed of India Vs West Indies one-dayer... what a harakiri by Indians.

Anyway, since I am not writing about candlestick pattern why not share ultimate secret of Stock Investing with you. So behold friends... all your questions and queries about investing are irrelevant and all you need is know this well kept and extremely guarded secret of stock markets.

This secret is exclusively bought to you by your friend... that is your's truly. Don't forget to thank me for this. Have a look at it here and let me know what you think of it.

Next post soon.